
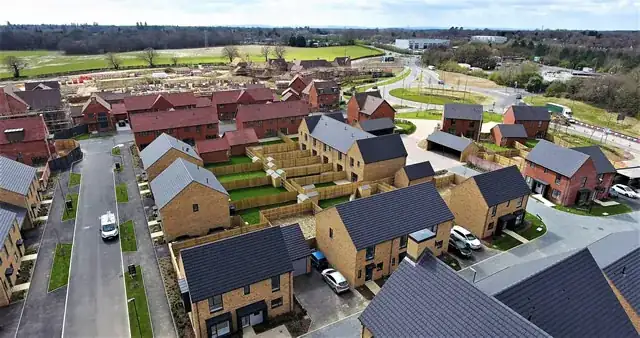
Housing & mixed use
Capacity, density and deliverability against the plan.
Planning intelligence for land in the UK
Enter a postcode to check Local Plan policy, recorded constraints and nearby decisions on official planning data. One free search, no account needed.
View Example Report — a complete worked example, clearly labelled as fictional.
Site report preview
Fictional exampleRecommended next action
Prepare for call for sites
Official published planning data
planning.data.gov.uk, Environment Agency, councils, PINS.
Every source identified
Each finding names the dataset it came from.
Confidence with every score
The score and its confidence are shown separately.
Retrieval dates shown
You always see when the evidence was last checked.
Why Logical Planning matters
The Government has committed to 1.5 million net additional homes in England this Parliament. Official estimates of what has actually been delivered so far sit well short of the pace that commitment implies, and the shortfall has to be found on land that is not yet allocated or permitted.
That gap is what moves planning decisions. Where an authority cannot demonstrate a five year housing land supply, or fails the Housing Delivery Test, the presumption in favour of sustainable development carries real weight, Green Belt boundaries come under review, and land that looked undevelopable can become genuinely promotable. Logical Planning exists to show landowners and developers, from published evidence, where their land sits in that picture.
National commitment
1,500,000homes
Government delivery target
Net additional homes targeted across England during the current Parliament, measured from 9 July 2024. No official annual trajectory or interim annual target has been published.
Delivered so far
392,400homes
Latest estimated progress
1,107,600 homes remain against the target — 26.2% delivered. Logical Planning calculation from the two verified figures above.
MHCLG estimate of net additional homes delivered between 9 July 2024 and 14 June 2026. Official estimate, subject to revision when confirmed net additional dwellings statistics are published.
Assessed need
370,000homes a year
Planning need
The changing combined total generated through the standard method for assessing minimum local housing need across England. It is a planning-need figure, not an annual national completions target, and the aggregate changes when dwelling-stock and affordability data are updated.
01
Local plans allocate land
Authorities set a housing requirement and allocate sites through the plan-making process, tested at examination.
02
Green Belt and grey belt are reviewed
Where need cannot be met elsewhere, authorities review Green Belt boundaries and identify grey belt land against the NPPF tests.
03
Land supply positions shift
Five year housing land supply and Housing Delivery Test results change how much weight policies carry in decisions.
04
Sites come forward
Applications, appeals and calls for sites move individual parcels through promotion, permission and delivery.
Screen a site against recorded constraints, the authority's plan position and nearby decisions, with every finding traced to its source.
Published supply positions and Housing Delivery Test results by authority, with the policy consequence of a shortfall.
Grey belt screening against the current NPPF tests, using published Green Belt and previously developed land evidence.
Enter a postcode or local planning authority name to see that authority's published plan stage, housing requirement, five year supply and Housing Delivery Test position.
Every figure on this page is held as a verified record with its publishing body, source link and the date we last checked it. Targets, official estimates and standard-method planning need are different measures and are labelled as such; the remaining balance and percentage are Logical Planning calculations from the verified figures shown. Where a measure cannot be verified we show “Not confirmed — further checks required” rather than a zero or an assumption, and national delivery figures are revised by Government over time.
Worked example
A fictional 4.62 hectare edge-of-settlement site in the Green Belt, scored against Local Plan policy, housing supply, recorded constraints and nearby decisions.
Recommended action
Prepare for call for sites
Where to start
The same evidence base, presented for the decision you are actually making.
How it works
Find the site by postcode, address or map, then trace the boundary and we measure it in hectares and acres.
Interface extract
Review Local Plan policy, recorded constraints, nearby decisions, indicative capacity, the score and its confidence.
Interface extract
Promote the land, prepare an application, monitor the Local Plan, or commission further investigation.
Interface extract
Built on official data
Every finding is traceable to its source dataset, with the date it was retrieved and an honest quality rating. Where a dataset is not published, we say so rather than estimating.
How findings are labelled
60
Official datasets under data control
31 operational at the last check
364
Local planning authorities tracked
25,129,170
Published records held
Last collection 30 Aug 2026
723
Land lots currently listed for sale
Not just housing
Capacity, density and deliverability against the plan.
Class MA, Class Q and prior approval routes.
Drive-thru, retail and employment schemes.
Inspectorate and court reasoning in plain English.
Brownfield land register
Local planning authorities must publish their brownfield land registers. We hold them in one searchable database so previously developed sites can be found, filtered and appraised alongside the rest of your evidence.
Postcode, address or drawn map extent, filtered by site area, authority, ownership and planning status.
Recorded dwelling capacity, deliverability and permission type exactly as the authority published them.
Each entry links to the official register record on the MHCLG Planning Data service under the Open Government Licence.
Common questions
Start with a free search, then take a full appraisal or ask us to promote the land on a success-fee basis.
This assessment is an automated planning intelligence report based on available public data. It does not constitute planning, legal, valuation or other professional advice and does not guarantee that planning permission will be granted.